What to Look for in a Softball Spray Chart App
By Carl Andrews · July 5, 2026
A softball spray chart app should do more than map hits. See what matters most for coaches, parents, and scorekeepers tracking games live.
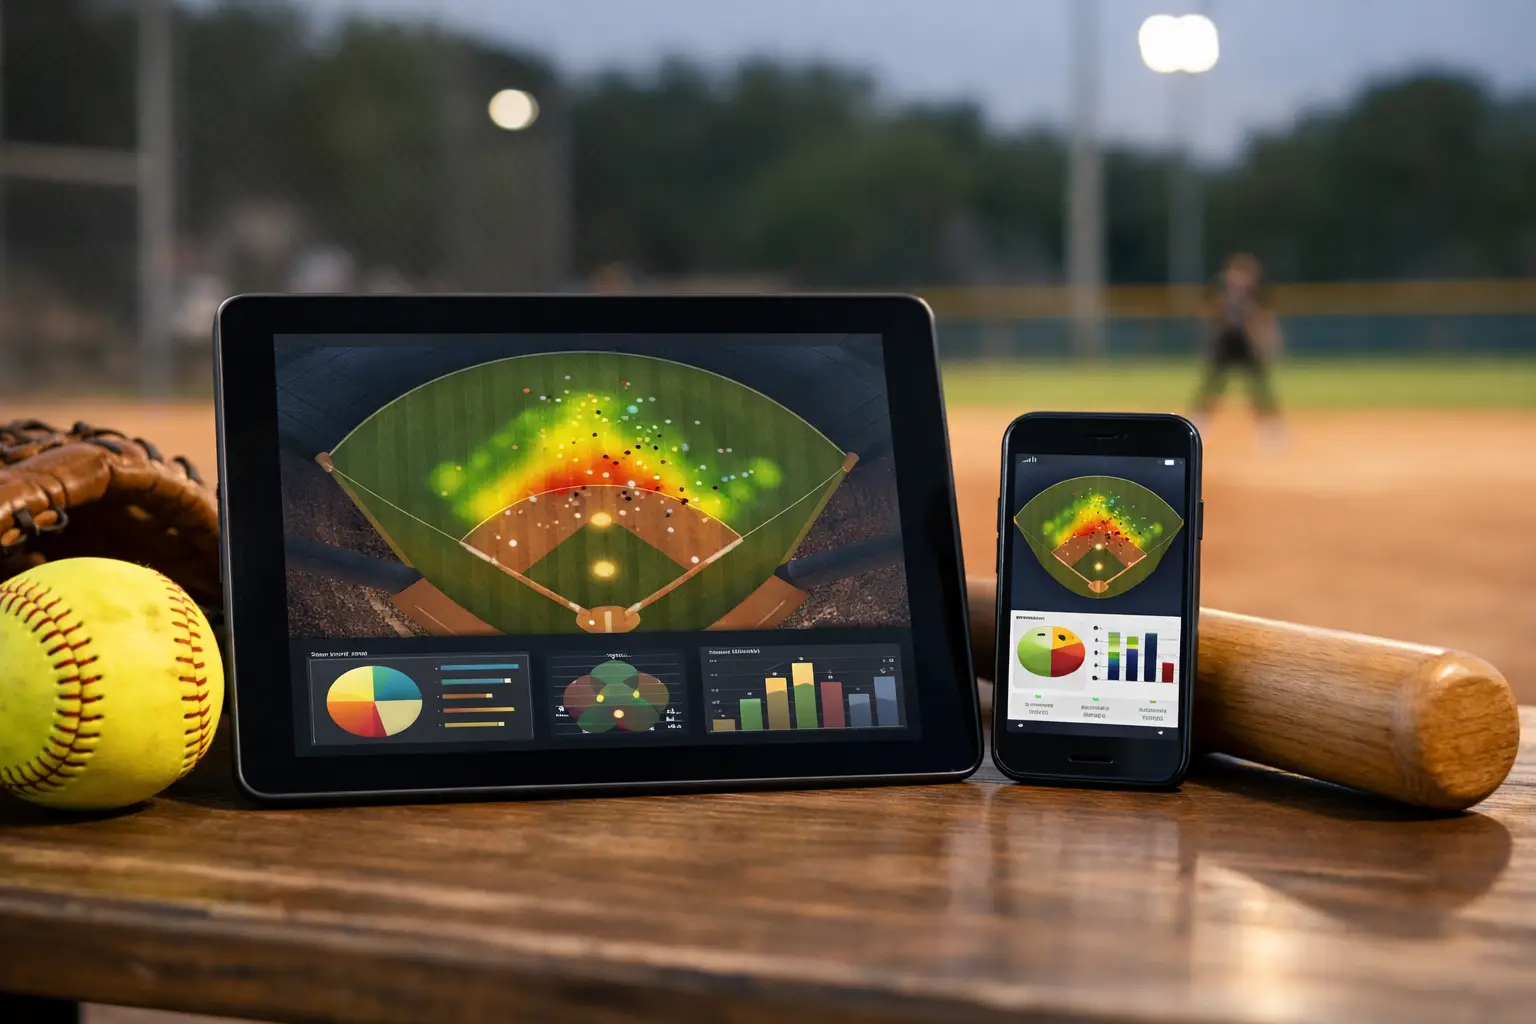
A line drive to left-center looks obvious when you see it live. Two weekends later, after four pool games, a bracket run, and a Monday night makeup game, that memory gets fuzzy fast. That is exactly where a softball spray chart app earns its spot. It turns "I think she was pulling the ball more" into something you can actually see, use, and trust.
For youth softball families and coaches, that matters more than people admit. Most teams are not staffed like college programs. The person keeping score is often a parent with a phone, a folding chair, and about three seconds between pitches. If a spray chart tool is going to help, it has to work in that world, not in some ideal version of it.
A softball spray chart app should start with live scoring
The biggest mistake people make when choosing a spray chart tool is treating the chart like a separate feature. It is not. A good spray chart is the result of good scoring.
If the app makes you enter data twice, clean it up later, or rebuild plays after the game, most teams will stop using it by week three. That is why the best setup is one where spray charts are created automatically from live game scoring. You record the at-bat once, mark where the ball was hit, and the chart builds itself as the game goes on.
That sounds simple, but it changes everything. It means the data is more complete. It means coaches can look at patterns while they still matter. It means parents are not trying to remember whether that hard grounder in the third went through the 5-6 hole or up the middle.
For youth teams, convenience is not a bonus feature. It is the difference between having season-long data and having another abandoned app.
The chart has to be easy to read and easy to use
Not every softball spray chart app is actually useful once the chart appears on screen. Some look flashy but force you to pinch, zoom, tap around, and squint to figure out what happened. That may be fine for a demo. It is not fine during a live game.
A good spray chart should answer basic questions quickly. Where is a hitter finding grass? Is she late and slicing balls to right? Is she rolling over pitches to the left side? Are most of her hard-hit balls staying in one lane, or is she using the whole field?
That means the app should show ball location clearly and keep the interface clean. Parents and volunteer scorekeepers should not need a clinic on data visualization just to log a single at-bat. If the app is built for the bleachers, not the press box, the chart will feel obvious the first time you use it.
There is also a trade-off here. Some systems offer extreme detail, but they slow down scoring so much that the data quality suffers. At the youth level, a slightly simpler chart that actually gets used every game is usually more valuable than a highly technical one that gets ignored.
Good spray charts help with coaching, not just recordkeeping
A spray chart is not just a nice graphic for the end-of-season slideshow. When it is tied to real game data, it becomes a coaching tool.
For hitters, it helps you spot tendencies without guessing. Maybe a player is getting jammed and everything is ending up on the left side. Maybe she is making solid opposite-field contact, but nobody noticed because the hits were spread across multiple weekends. Maybe her outs are loud, and the chart shows she is squaring balls up better than the batting average suggests.
For coaches, that gives you something concrete to work with in practice. You are not telling a player to "stay through the middle" because it sounds right. You are showing her a pattern and connecting it to an adjustment.
For parents, it also changes how player development is remembered. A season is long. Kids improve in small ways that are easy to miss. A chart can show progress that a box score alone will not. A hitter who starts spraying line drives to all fields may be growing, even before the stat line catches up.
The best softball spray chart app connects to the rest of the stats
A chart by itself is useful. A chart tied to the full stat picture is much better.
If a player is pulling the ball a lot, what does that mean alongside her batting average, on-base percentage, or extra-base hits? If most balls are hit to the right side, is that because she is consistently behind, or because she is doing a good job taking outside pitches where they are thrown? If a pitcher is giving up hard contact to one zone of the field, is that happening with certain pitch locations or in certain counts?
This is where standalone chart tools often fall short. They may map contact, but they do not connect that map to the larger story of the game or season. For youth teams, that usually means more manual work, more guesswork, and more time flipping between apps, notebooks, or spreadsheets.
A better approach is one platform that turns in-game scoring into spray charts, box scores, and season stats automatically. That keeps the information in one place and makes it much easier to use after the game. Baseball Stats Tracker fits that model well because the spray chart is part of the bigger scoring workflow, not an add-on that creates more work.
Cost matters more than most apps want to admit
Youth sports families know how fast fees pile up. Tournament entry fees, uniforms, team dues, gas, hotels, lessons, and replacement gloves already take enough out of the family budget. Software should not quietly become another monthly bill that keeps charging long after the season changes.
That is why pricing matters when you evaluate a softball spray chart app. If the app locks useful features behind a subscription, you need to ask a simple question: will this still feel worth it in month six, especially if only one or two people on the team use it consistently?
For many rec and travel teams, a one-time purchase makes far more sense. It removes the pressure to "get your money's worth" every month and makes the tool feel practical instead of expensive. It also fits the reality that youth teams change year to year. Rosters shift. Coaches rotate. Seasons overlap.
There is no magic pricing model that fits every team, but recurring fees are often hardest to justify at the grassroots level. A useful app that stays affordable tends to last longer in real team routines.
Multi-device access is not optional anymore
If one person has all the stats trapped on one phone, the app is already less useful than it should be.
A modern softball spray chart app should let coaches, parents, and team supporters access game information from different devices without a complicated setup. One person may score from behind the backstop. Another parent may want to follow along from work. A coach may want to review charts later from a laptop instead of a phone.
That flexibility matters because youth sports are messy in a normal, everyday way. People switch devices. Batteries die. Grandparents ask for updates. Assistants want lineup info. If the app only works smoothly in one spot, with one person, under perfect conditions, it will eventually become a hassle.
Browser-based access is especially useful here because it avoids some of the friction that comes with app installs, updates, and device limitations. It is one less thing for busy families to manage.
What actually makes a spray chart worth keeping all season
The best test is simple: will your team still use it in April, in June, and during that long Saturday in July?
A worthwhile softball spray chart app should be fast enough for live use, simple enough for non-experts, connected enough to broader stats, and affordable enough that it does not feel like another sports tax. It should preserve player performance in a form that is useful now and meaningful later.
That last part matters. Families are not just tracking dots on a field. They are keeping a record of growth. Coaches are not just logging contact direction. They are building better practices and making better lineup decisions. A good spray chart app respects both jobs.
If the tool saves time, shows real patterns, and does not bury the value under subscriptions or extra work, it has a real place on a youth softball team. And when a parent can score from the bleachers, a coach can teach from the data, and a player can actually see her progress, that is when the numbers start doing something useful.
One payment. Every season.
Live scoring, automatic stats, spray charts. $39 once, no subscription.
Get Instant Access — $3930-day money-back guarantee — no questions asked.