How to Track Youth Baseball Pitching Stats
By Carl Andrews · July 3, 2026
Learn how to track youth baseball pitching stats accurately, what numbers matter most, and how to use them to support player development all season.
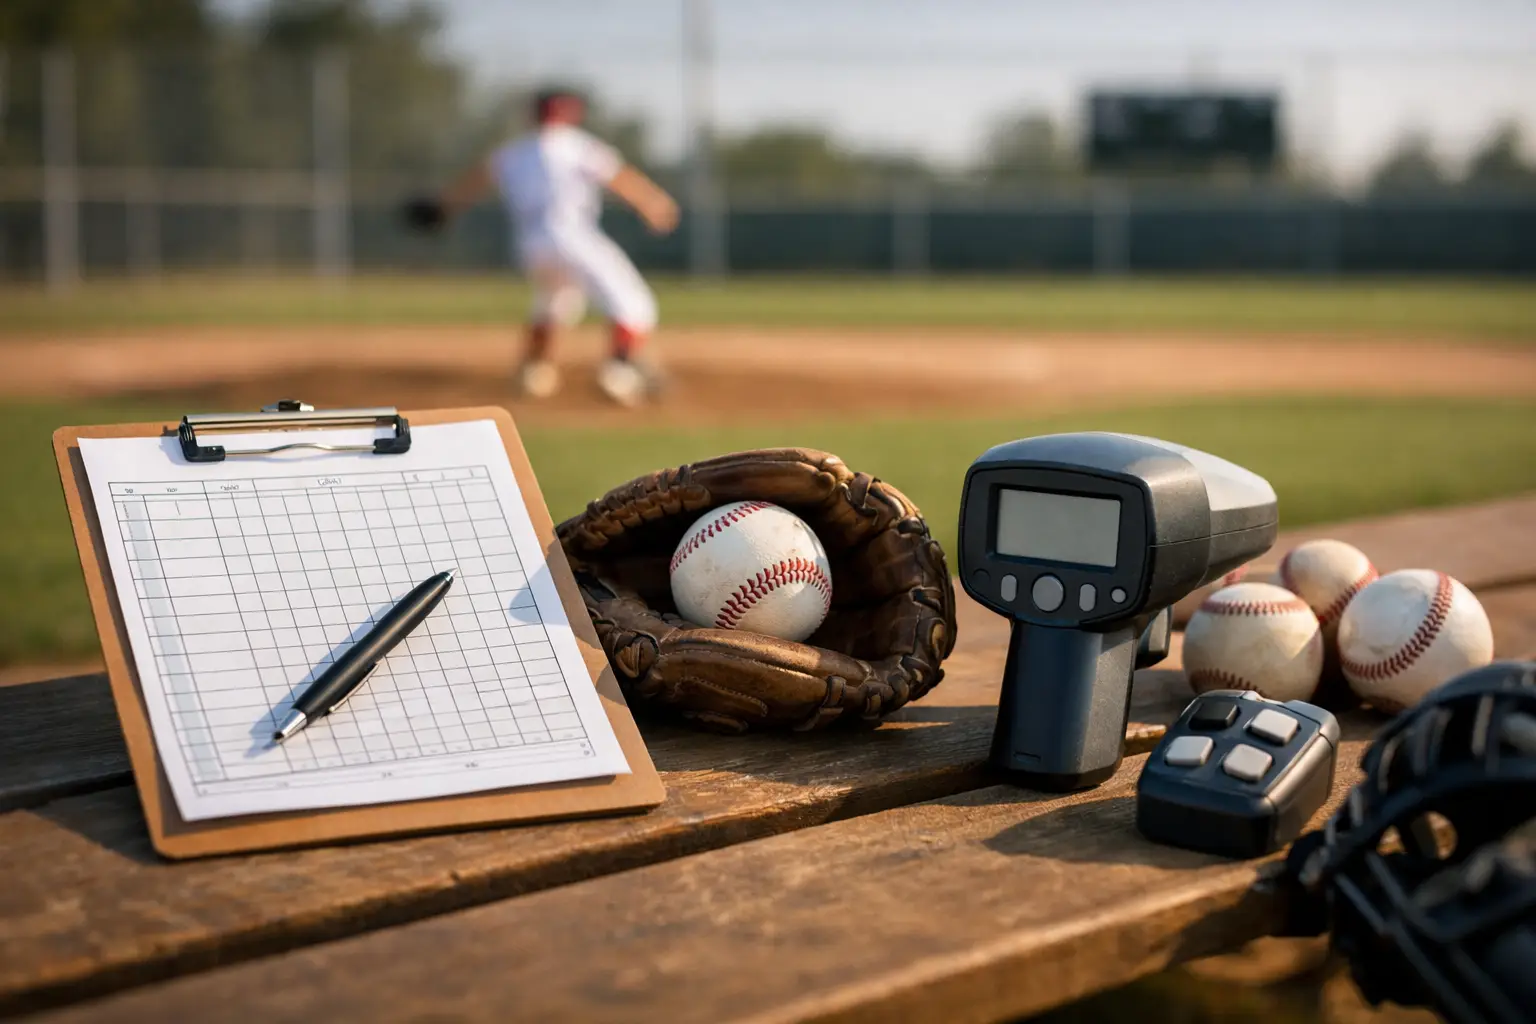
Most youth pitching problems show up before the scoreboard tells you anything. A kid walks three hitters, throws one wild pitch, and suddenly everyone says he "just didn’t have it." But if you track youth baseball pitching stats the right way, you can see whether the issue was command, pitch count, too many deep counts, weak defense behind him, or simply one rough inning.
That matters more in youth baseball than people realize. At this level, pitching stats should help adults make better decisions, not just label kids as good or bad. The goal is to spot patterns, protect arms, and give coaches and parents a clearer picture of progress over a season.
Why track youth baseball pitching stats at all?
A lot of teams still rely on memory, a paper scorebook, or a text thread after the game. That usually means the details disappear by the time the weekend is over. You remember the strikeouts. You forget the long at-bats, the hit batters, the inherited runners, and how many pitches it took to get through two innings.
When you track pitching consistently, you get something much more useful than a final line score. You get context. A pitcher who gave up two runs might have thrown well and been hurt by errors. Another kid might have posted a scoreless inning but needed 28 pitches to get there. Those are very different outings, and they should be treated differently.
For families, the value is simple. You preserve the season. For coaches, the value is even more practical. You can manage workload, spot command issues early, and make lineup decisions based on real information instead of guesswork.
The pitching stats that actually matter in youth baseball
Not every stat matters equally at age 8, 10, 12, or even 14. In youth baseball, the best numbers are the ones that help you understand control, efficiency, and development.
Start with the basics
Innings pitched, pitches thrown, strikes, balls, walks, strikeouts, hits allowed, runs allowed, earned runs, and hit batters are the foundation. If you’re not capturing those consistently, anything more advanced will be shaky.
Pitch count is one of the most important numbers on the page. Not because it looks impressive, but because it protects players. A pitcher who gets quick outs can come back sooner and stay stronger deeper into games. A pitcher who burns through 35 pitches in one inning is telling you something, even if no runs scored.
Walks and hit batters also carry extra weight in youth baseball. They usually point to command, mechanics, nerves, or fatigue. At younger ages, they often matter more than batting average against.
Then look at efficiency stats
Once the basics are solid, a few simple rate stats become helpful. Strike percentage is a big one. It tells you more than raw strikeout totals because it shows whether the pitcher is consistently around the zone.
Pitches per inning is another good reality check. So is WHIP, which measures walks plus hits per inning pitched. Even at the youth level, WHIP is useful because it captures how many baserunners a pitcher allows. Lower traffic usually means less stress, fewer big innings, and better outcomes.
ERA can be helpful, but it has limits in youth baseball. Defensive mistakes, inconsistent scorekeeping, and short outing samples can make it noisy. That doesn’t mean ignore it. It means don’t treat it like the whole story.
What stats can mislead you
This is where a lot of teams get tripped up. They track a number because it sounds official, not because it helps.
Wins are a classic example. In youth baseball, wins often reflect run support, defensive quality, and league rules more than individual pitching performance. A pitcher can throw great and get no decision. Another can struggle and still get the win because his team scored ten runs.
Strikeouts can be misleading too. Yes, they matter. But a pitcher who records five strikeouts and five walks may have had a much shakier outing than a pitcher who struck out two and threw 70 percent strikes. Youth coaches know this instinctively. The stats should support that instinct, not override it.
Velocity gets too much attention in some circles as well. Unless you’re working with older, advanced players and reliable measurement, command and efficiency usually matter more. Most youth pitchers do not need to chase radar-gun validation.
How to track youth baseball pitching stats without making it a chore
This is where most systems fall apart. The problem usually isn’t motivation. It’s friction.
Paper scorebooks feel manageable until a game gets messy. Spreadsheets seem simple until someone forgets to update them. Team apps can work, but recurring fees and cluttered workflows wear people down fast. If tracking takes too long, the season outlasts the system.
The easiest setup is one that lets a parent, coach, or supporter score live from a phone or tablet while the game is happening. That way every pitch result, walk, strikeout, and run allowed gets captured once, in the moment, instead of reconstructed later from memory.
A good youth-focused tracker should also calculate stats automatically. Nobody wants to spend Sunday night translating handwritten notes into season totals. When the system updates ERA, WHIP, pitch counts, box scores, and splits for you, you actually keep using it. That’s the difference between a nice idea and a tool that survives a full spring and summer schedule.
Keep your scorekeeping standards simple and consistent
Perfect scorekeeping is not the goal. Consistent scorekeeping is.
If one parent records every borderline play as a hit and another records the same play as an error, your stats will drift. The fix is not to become a professional official scorer. The fix is to agree on a basic team standard and stick with it.
For youth teams, it helps to keep a practical mindset. Record walks, strikeouts, hit batters, and pitch counts carefully because those are straightforward and high value. For hits, errors, and earned runs, do your best and stay consistent. Over time, the trends still tell you a lot.
It also helps to assign one primary scorekeeper when possible. Shared access is great, but one steady hand reduces confusion.
How coaches and parents should use the numbers
Stats should start conversations, not end them.
If a pitcher’s walk rate jumps over three outings, that doesn’t automatically mean he’s regressing. Maybe he’s pitching tired. Maybe he changed mechanics. Maybe he faced a more patient lineup. The number points you toward the question.
The same goes for pitch count trends. If a player routinely needs 20-plus pitches per inning, that may suggest command problems or too many hitters getting to two-strike counts and surviving. If his strike percentage is improving and pitches per inning are dropping, that’s a real development story even if the ERA hasn’t caught up yet.
Parents can use these stats in a healthy way too. Instead of saying, "You gave up three runs," they can say, "You threw more strikes today," or "You attacked hitters earlier in the count." That shifts the focus from judgment to growth.
The best time to start is the first game, not midseason
The biggest mistake teams make is waiting until the games feel important. By then, half the season is already gone and the early development story is missing.
Start from game one, even if your process isn’t perfect yet. Early-season outings often reveal the clearest growth. You’ll see who settled in, who built stamina, who improved command, and who needed a lighter workload. Those details get lost when you begin tracking after tournaments start or playoff seeds matter.
This is also why permanent, season-long records matter. Families want more than a few final numbers. They want a real history of the year. Coaches want something they can revisit when planning roles, evaluating progress, or simply remembering how far a player came.
For teams that want a straightforward option, Baseball Stats Tracker was built for exactly this kind of real-world use - live scoring from the bleachers, automatic pitching stats, and a one-time purchase instead of another monthly bill.
What good pitching data really gives you
It gives you fewer arguments based on memory. It gives you better workload awareness. It gives kids credit for progress that might not show up in one scoreboard line.
Most of all, it gives your team a record worth keeping. Youth baseball seasons move fast. One weekend rolls into the next, and before long the year is over. If you tracked the games well, you don’t have to guess who improved, who battled, or what those innings meant.
That’s the real value. Not more numbers for the sake of numbers. Just a clearer view of the season your players actually had.
One payment. Every season.
Live scoring, automatic stats, spray charts. $39 once, no subscription.
Get Instant Access — $3930-day money-back guarantee — no questions asked.